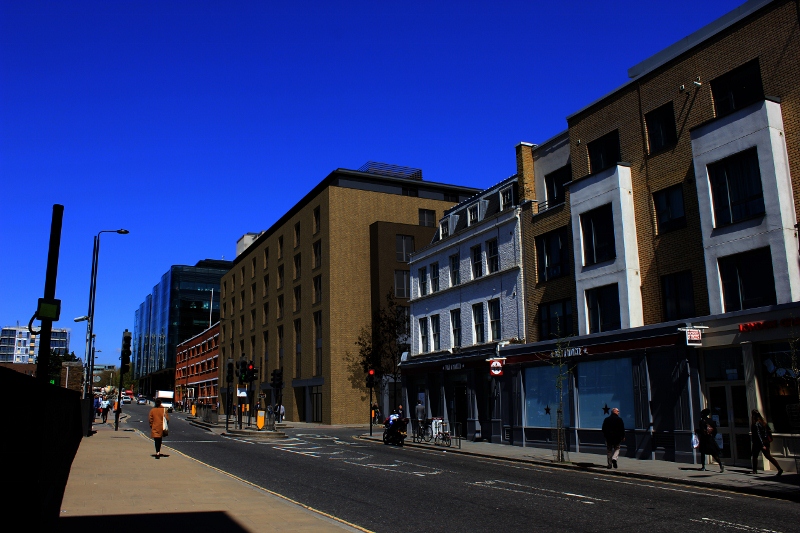
We wanted to start putting Census data together for our area, a half mile radius from the perimeter of King’s Cross Station. This is how I did it.
The Office for National Statistics makes a range of data freely available to the public on its NOMIS online database.
It stores a range of datasets including the Census, claimant counts and information about businesses.

NOMIS datasets
The datasets are broken down by a mind boggling array of area types including local authorities, constituencies, wards and the smallest ‘super output areas’ (SOAs). I needed the smallest possible SOA which is the Lower SOA (there’s a larger Middle SOA).
Lower super output areas (LSOAs) can change as they are defined by population and household size, so they have to change as populations rise and fall. The minimum population of an LSOA is 1,000 and maximum is 3,000 (or by household it’s no less than 400 and no more than 1,200). LSOAs are known by codes, for example the LSOA I live in is Islington 021B. To get data out of NOMIS for a list of LSOAs means identifying the LSOAs, it was this that took most time. I found the Office for National Statistics Geography site a bit daunting so decided to go it alone. Others may find ONS Geography easier to use than I did.
If you don’t know the LSOAs you need for your data, a good place to start is the Mapit website. Here you enter a postcode and it will give you a host of information including ward, London, Parliamentary and European constituencies and mid and lower SOA code. Once you have one LSOA code you can start building your own list of LSOAs to search NOMIS on. I used a single LSOA code to start and built the whole list from there using NOMIS’ handy little mapping icons. I went one step further and produced a map of our whole area, taking each individual LSOA map and knitting them together:

Our area comprises 29 LSOAs. If you do put your own list together a handy tip is to save your list on NOMIS so that you don’t have to keep typing it in for each bit of data you want to download. To do this, register on the NOMIS site, start an Advanced Query and type in your LSOAs then click to save the list. You can now download data for your list with one easy click.
NOMIS lets you choose how you want data downloaded, I used the Excel spreadsheet. Each data query is layed out very clearly. I just tweaked each spreadsheet I downloaded to explain the area selection, give totals and so on. For example, here’s the population density data downloaded for Excel and tweaked a bit:

So what have I found so far? Some handy headlines for King’s Cross from the 2011 Census:
Population 48,352
The area covered by the LSOAs is 379 hectares
(slightly larger than our catchment as I’ve included all LSOAs that fall entirely or partially within a half mile of the station)
That’s 128 people per hectare
(population density will increase massively soon because of all the property development that’s happening)
We are about 50/50 female and male
23,473 or 54% of us live in social rented housing
11,964 or 27% of us rent from a private landlord
6,948 or 16% of us are home owners
3,689 or 8% of people here are unpaid carers
7,821 or 16% of people here have a limiting illness or disability
There are 5,845 vehicles owned or available to people living here – that’s 0.12 per person
Sophie Talbot volunteers for King’s Cross Community Projects – the charity is run entirely by volunteers. She is setting up her own web design business (cookiewp.com) to fund her voluntary work. She’s open to job offers!

 7pm Wednesday 19th February London Canal Museum